- Home
- Environmental KPIs
Environmental KPIs
Data has become the most important tool for analysing business sustainability.

Measure environmental performance of your business
Corporate environmental performance is measured by key performance indicators (KPIs): Emissions of Greenhouse Gases, Water Consumption, Waste Production and Gross Value Added. Performance is benchmarked against the production frontier estimated by Data Envelopment Analysis.
Calculate your business’s carbon footprint
Depending on the sector your business operates in, knowing your carbon footprint could be a regulatory requirement.
The Over-C platform aims to help businesses to identify carbon-saving opportunities. Knowing your environmental performance will help your business to stay competitive, more efficient and to remain compliant with regulatory requirements.
Understand your energy & water consumption
Historically, efforts to improve water and energy efficiency have been pursued separately. However, energy and water are intricately connected. All sources of energy (including electricity) require water in their production processes. Energy is itself required to make water resources available for human use and consumption.
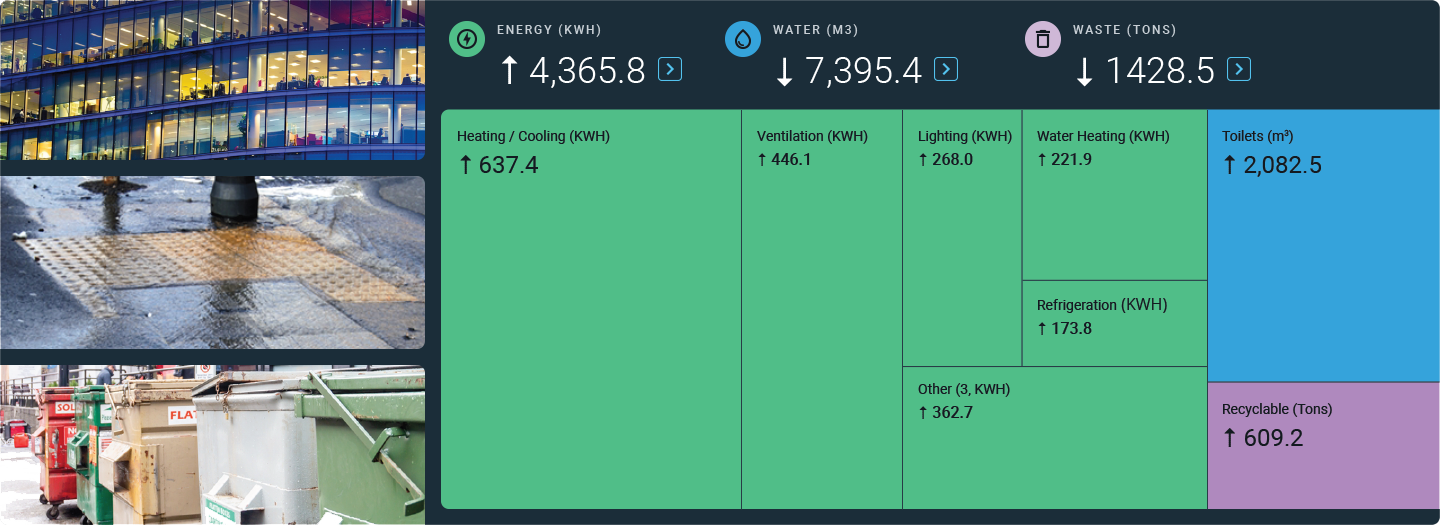
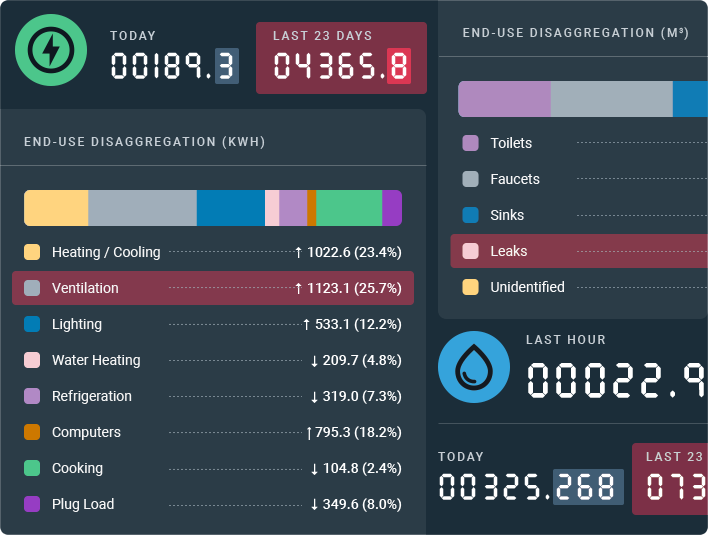
The Over-C platform is utilising IoT technology to capture data behind environmental performance of your business, analyses it and provides an insight into your business’s environmental performance via its dedicated ESG section in Analytics Dashboards. Here are a few examples of the knowledge it generates:
- Direct emission figures and end-use disaggregation analysis of the performance indicators contributing into direct emissions total figures.
- End-use disaggregation by contributing activities, channels, locations or zones.
- Location or zone benchmarking
- Monthly savings potential (%)
Monitor Air Quality
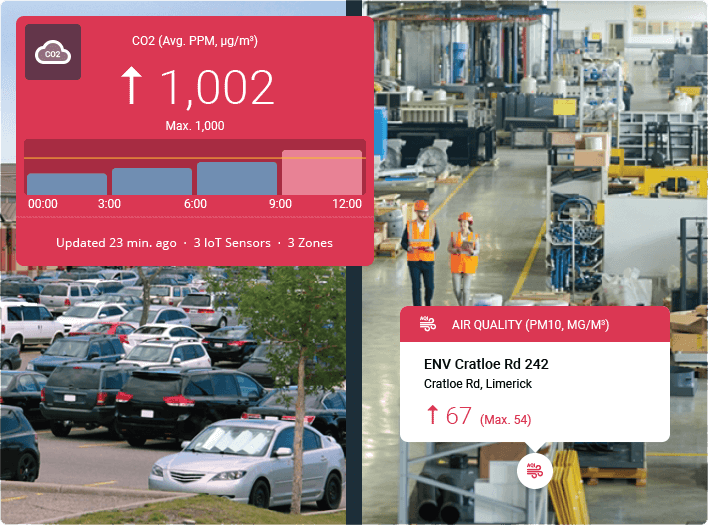
Air quality isn’t the same everywhere. Pollution can build up in isolated pockets, and local sources like a busy road, parking lot or outdated equipment can add to the overall poor air quality. Also the weather conditions in an area or a poorly designed layout of a building can play a part in the quality of the air.
Because different areas have different levels of air quality at different times of the day, or different seasons, it is important to monitor what is happening. This can be achieved by using IoT sensors and the Over-C platform.
Over-C’s Analytics Dashboards can provide your business with macro and micro views surrounding air quality and other indoor and outdoor performance indicators.
- Air quality
- Use by location / zone
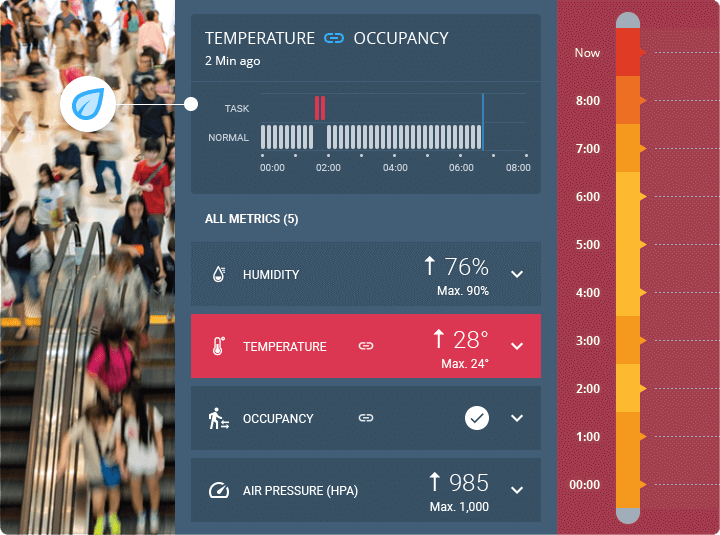
Environment control for indoors & outdoors
Experience shows that most of the problems that occur in indoor environments are the result of decisions made during the design and construction of a building. Although these problems can be solved later by taking corrective measures.
The following environmental measurements can be monitored and analysed by the Over-C platform:
- Temperature
- Humidity
- Light
- Noise
- Atmospheric pressure
- Air quality (AQI)
Any anomalies in the indoor and outdoor environment can be instantly detected and automatically responded by dynamic actions available with the IoT-powered Over-C platform.
Waste management
Waste is part of life in any business, town and large city.
The IoT-powered Over-C platform has capabilities for monitoring and helping to retain efficiency and high health & safety standards in waste collection and recycling.
Sensor profiles available with the Over-C platform allow users to dynamically monitor level of waste in skips, containers and bins using dynamic actions and triggers without any manual checks based on typical schedules. Once waste level is reached to a maximum permissible, dynamic action is launched and collection is automatically communicated to the relevant team. Daily or monthly data behind total generated waste, its disaggregation per a source or zone and monthly saving potential (%) is available in the Over-C’s Analytics Dashboards.
This is how waste collection processes can be optimised, unnecessary expenses can be eliminated with IoT-powered services provided by Over-C. And carbon footprint organisation can be reduced as a result.

Disaster prevention, preparedness & early response
With climate change the risk of natural disasters have dramatically increased in the recent decade.
IoT technologies can’t stop disasters from happening, but they can be very useful for disaster preparedness to act as an early warning system and predictive analytics. Such natural disasters like flooding or forest fire can be detected at an early stage of their development.
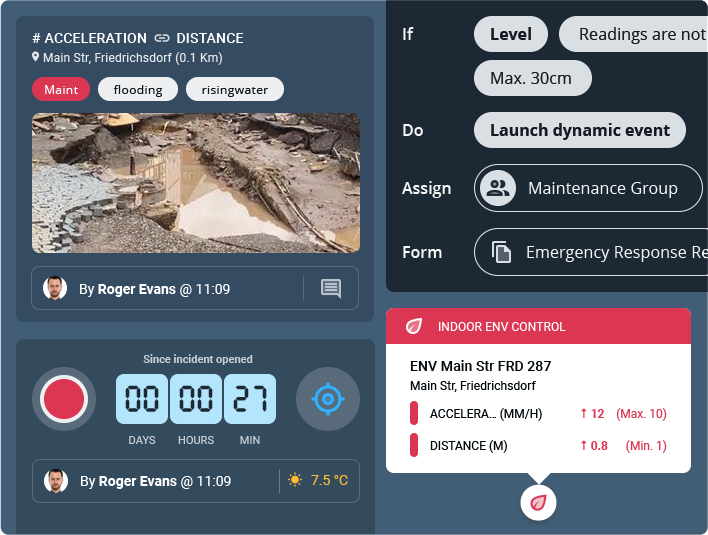
The IoT-powered Over-C platform is focused on capturing data, analysing it, launching and broadcasting dynamic actions to help saving lives and property. IoT sensors monitor measurements such as temperature, CO2, humidity, water level and air quality and set an early warning system alert to inform your staff and customers.
These are the unique capabilities of the Over-C platform that help to monitor, prepare and respond to variety of natural disasters:
- Rule engine & sensor profiles deliver dynamic actions as soon as data becomes available and without reliance on manual input.
- Single & linked measurements help to tailor triggers for the dynamic events.
- Instant broadcast & response keeps everyone notified in real-time.
- Reporting & advanced analytics provide your business with the insight into historical data, root causes of the issues and team performance
Interested in learning more about how Over-C can help?
Call +44 20 7873 2352 or Request a consultation
Direct emission analytics & reporting

The Over-C platform equips businesses with ESG Analytics Dashboards, providing real-time environmental performance data. It focuses on key areas such as energy and water consumption, waste management, and direct emissions insights.
A big picture behind your organisation’s” doesn’t seem right either. Can we try “The Analytics Dashboard gives a high-level overview of your organisation’s environmental performance, while the map view offers detailed insights into end-use disaggregation and performance across specific zones and locations.
Direct emission analytics & reporting

The Over-C platform equips businesses with ESG Analytics Dashboards, showing real-time environmental performance data of your organisation with the main focus on Energy and Water consumption, Waste Management and provides an overall Direct Emission Insights.
Header
The Over-C platform equips businesses with ESG Analytics Dashboards, showing real-time environmental performance data of your organisation with the main focus on Energy and Water consumption, Waste Management and provides an overall Direct Emission Insights.
Header
The Dashboard’s Analytics view provides a big picture behind your organisation’s environmental performance. And the Map view provides fine details behind end-use disaggregation and environmental performance of the specific zones and locations.
Header
Lorem ipsum dolor sit amet, consectetur adipiscing elit, sed do eiusmod tempor incididunt ut labore et dolore magna .
Header
Lorem ipsum dolor sit amet, consectetur adipiscing elit, sed do eiusmod tempor incididunt ut labore et dolore magna aliqua. Ut enim ad minim veniam, quis nostrud exercitation ullamco laboris nisi ut aliquip ex ea commodo consequat. Duis aute irure dolor in reprehenderit in voluptate velit esse cillum dolore eu fugiat nulla pariatur. Excepteur sint occaecat cupidatat non proident, sunt in culpa qui officia deserunt mollit anim id est laborum.
Header
Lorem ipsum dolor sit amet, consectetur adipiscing elit, sed do eiusmod tempor incididunt ut labore et dolore magna .


